


Do you know you can monitor stock prices or earnings per share within Google sheet?
I didn't until I saw it in a tweet a couple of days ago. You can simply type a query like =GOOGLEFINANCE("GOOG", "price", DATE(2019,1,1), DATE(2019,12,31), "DAILY") into a google sheet to populate the data through Google finance (documentation here).
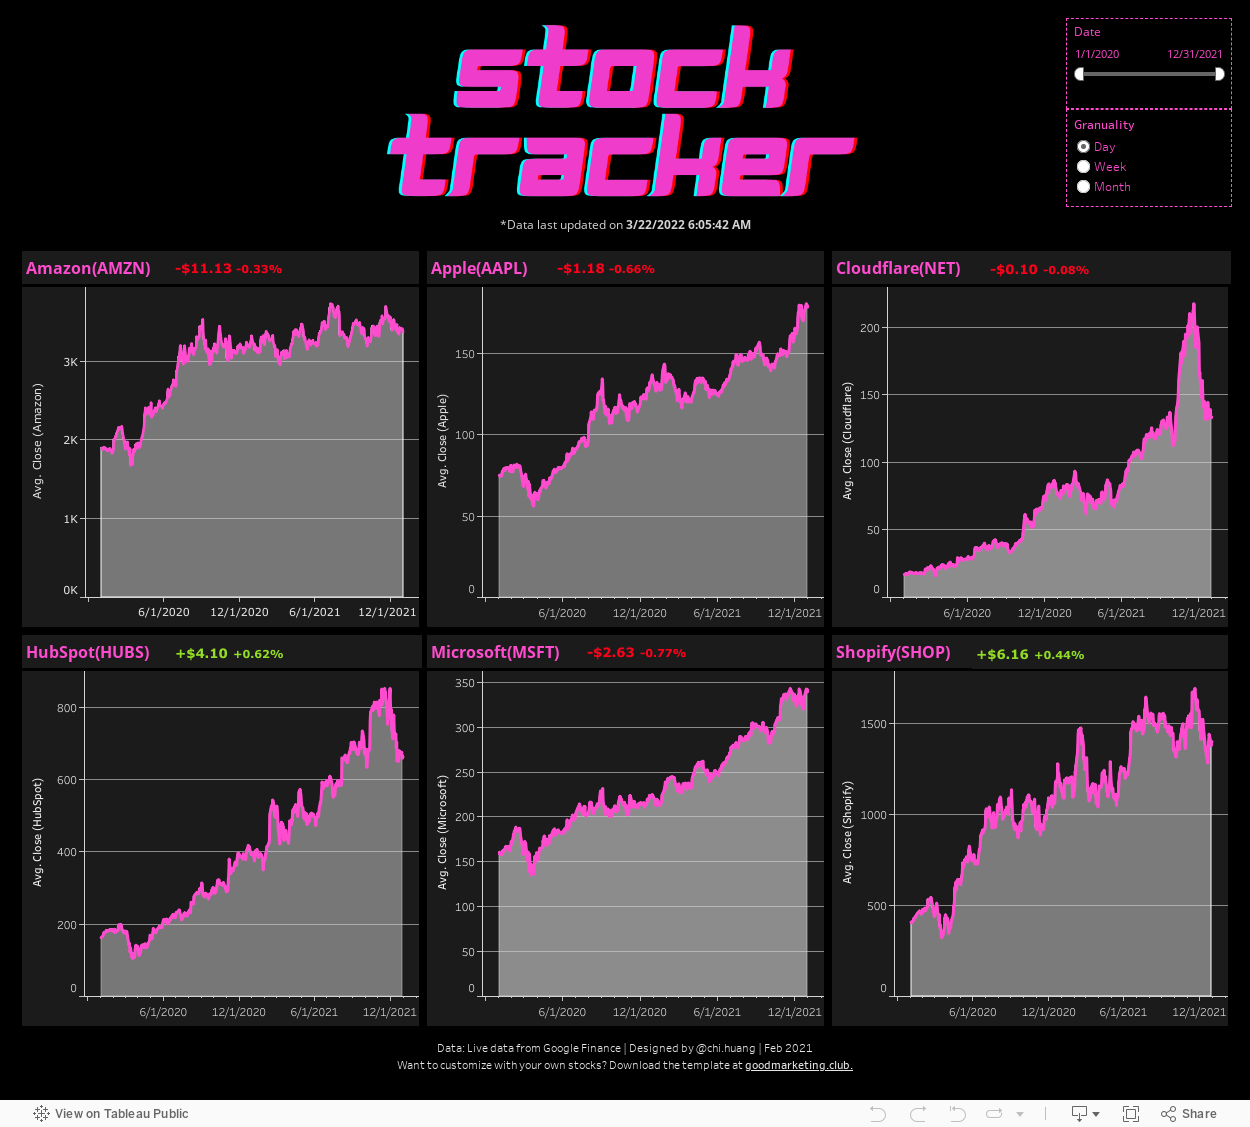
With the stock data handy, I was inspired to put together a stock tracker dashboard with Tableau (you've probably noticed I am very into neon colors recently).
P.S. You can download the Tableau workbook and data here to customize your own stock tracker!
*Dashboard images made with Canva.
We opened a shop for you! Get 10% off with the code CLUBMEMBER
Take Coin to the Moon Cotton T-shirt | Etsy
Take Coin to the Moon Cotton T-shirt. Original design100% CottonClassic fitRuns true to size


To The Moon Stickers | Etsy
The coolest sticker on earth - to the moon! 3 sizes to choose fromGrey, adhesive back

The Visualizer Tote | Etsy
A tote bag designed for the visualizers. Size: 14.75″W x 14.75″H; 22″ Handles; 3.5″ GussetColor: Natural or WhiteMaterial: 100% Cotton Canvas; Heavy-Duty Woven HandlesPrinting Method: Laser Ink TransferCare: Spot Clean with Mild Soap and Water


![Sample Size Calculator [Tableau Workbook]](/content/images/size/w300/2021/09/samplesizecalculator.png)